[CBSE] Q. 89 Solution of Accounting Ratios TS Grewal Class 12 (2025-26)
Solution of Question 89 Accounting Ratios of TS Grewal Book 2025-26 session CBSE Board?

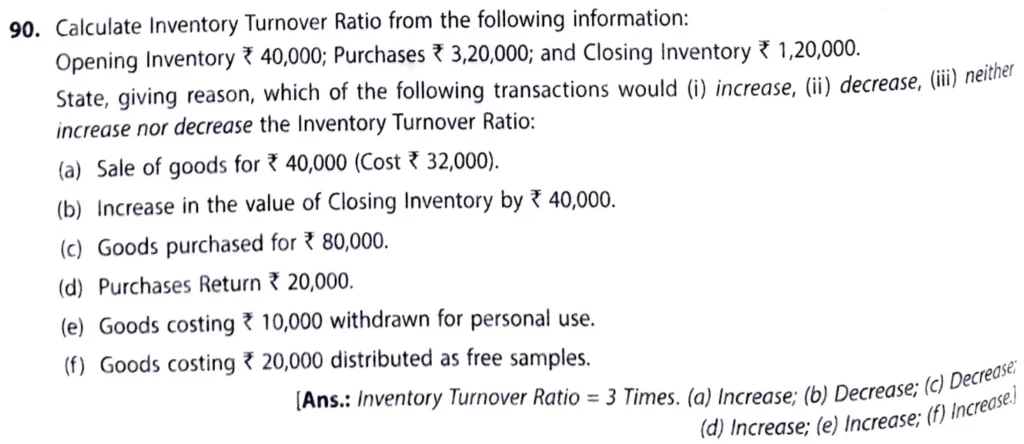
Calculate Inventory Turnover Ratio from the following information:
Opening Inventory ₹ 40,000; Purchases ₹ 3,20,000; and Closing Inventory ₹ 1,20,000.

State, giving reason, which of the following transactions would (i) increase, (ii) decrease, (iii) neither increase nor decrease the Inventory Turnover Ratio:
(a) Sale of goods for ₹ 40,000 (Cost ₹ 32,000).
(b) Increase in the value of Closing Inventory by ₹ 40,000.
(c) Goods Purchased for ₹ 80,000.
(d) Purchases Return ₹ 20,000.
(e) Goods costing ₹ 10,000 withdrawn for personal use.
(f) Goods costing ₹ 20,000 distributed as free samples.
[Ans.: Inventory Turnover Ratio = 3 Times. (a) Incraese; (b) Decrease; (c) Decrease (d) Increase (e) Increase (f) Increase
Solution:-
Inventory Turnover Ratio:-
= Cost of Revenue from Operations/Average Inventory
= 2,40,000/80,000
= 3 Times
Cost of Revenue from Operations = Opening Inventory + Purchases – Closing Inventory
Cost of Revenue from Operations:-
= ₹ 40,000 + ₹ 3,20,000 – ₹ 1,20,000 = ₹ 2,40,000
Average Inventory:-
= Opening Inventory + Closing Inventory/2
= ₹ 40,000 + ₹ 1,20,000 = ₹ 1,60,000/2 = ₹ 80,000
(a) Sale of goods for ₹ 40,000 (Cost ₹ 32,000)
To determine the impact of the sale of goods on the Inventory Turnover Ratio (ITR), we can follow these steps:
Step 1: Understand the ITR formula
The formula is:
Inventory Turnover Ratio = Cost of Revenue from Operations / Average Inventory
Step 2: Initial calculation of ITR
Cost of Revenue from Operations (original): ₹ 2,40,000
Average Inventory (original): ₹ 80,000
Initial Inventory Turnover Ratio:
ITR = 2,40,000/80,000 = 3 Times
Step 3: Adjust values for the sale of goods
The above transaction will decrease the closing stock. It will further increase the cost of revenue from operations. and decrease the Average Inventory.
- The sale increases the Cost of Revenue from Operations by ₹ 32,000.
Adjusted Cost of Revenue from Operations = ₹ 2,40,000 + ₹ 32,000 = ₹ 2,72,000 - The sale reduces the Average Inventory by ₹ 32,000.
Adjusted Average Inventory = ₹ 80,000 – ₹ 32,000 = ₹ 48,000
Step 4: Calculate the adjusted ITR
Adjusted ITR = 2,72,000/48,000
Adjusted ITR = 5.67 times
Conclusion:
The sale of goods increases the Inventory Turnover Ratio from 3 times to 5.67 times, indicating faster inventory turnover.
This shift reflects improved efficiency in selling and managing inventory.
(b) Increase in the value of Closing Inventory by ₹ 40,000
Reason:- Increase in Closing Stock results decrease in Cost of Goods sold and Increase in Average Stock
(C) Goods Purchased for ₹ 80,000 – Decrease
Let’s assess the impact of purchasing goods on the Inventory Turnover Ratio (ITR). Here’s the step-by-step breakdown:
Step 1: Recall the formula
Inventory Turnover Ratio = Cost of Revenue from Operations / Average Inventory
Step 2: Initial values
Cost of Revenue from Operations (original): ₹ 2,40,000
Average Inventory (original): ₹ 80,000
Initial Inventory Turnover Ratio:
$$\text{ITR} = \frac{2,40,000}{80,000} = 3$$
Step 3: Adjust values after the purchase
The purchase of goods for ₹ 80,000 affects Average Inventory but does not directly impact the Cost of Revenue from Operations unless these goods are sold during the accounting period.
- Adjusted Average Inventory = ₹ 80,000 + ₹ 80,000 = ₹ 1,60,000
- Cost of Revenue from Operations remains unchanged at ₹ 2,40,000 (for now).
Step 4: Recalculate the ITR
Adjusted ITR:
$$\text{ITR} = \frac{2,40,000}{1,60,000} = 1.5$$
Conclusion:
After purchasing goods worth ₹ 80,000, the Inventory Turnover Ratio decreases from 3 times to 1.5 times, indicating slower inventory turnover because of the increased inventory being held.
(d) Purchase Return ₹ 20,000 – Increase
Let’s determine how a purchase return affects the Inventory Turnover Ratio (ITR). Here’s the analysis:
Step 1: Recall the formula
Inventory Turnover Ratio = Cost of Revenue from Operations / Average Inventory
Step 2: Initial values
Cost of Revenue from Operations (original): ₹ 2,40,000
Average Inventory (original): ₹ 80,000
Initial Inventory Turnover Ratio:
$$\text{ITR} = \frac{2,40,000}{80,000} = 3$$
Step 3: Adjust values for the purchase return
The purchase return reduces the Average Inventory but does not directly impact the Cost of Revenue from Operations, as returns pertain to inventory rather than sales.
- Adjusted Average Inventory = ₹ 80,000 – ₹ 20,000 = ₹ 60,000
- Cost of Revenue from Operations remains unchanged at ₹ 2,40,000.
Step 4: Recalculate the ITR
Adjusted ITR:
ITR = 2,40,000/60,000} = 4 Times
Conclusion:
A purchase return of ₹ 20,000 increases the Inventory Turnover Ratio from 3 times to 4 times, indicating faster inventory turnover due to the decrease in average inventory held.
(e) Goods costing ₹ 10,000 withdrawn for personal use.
Let’s analyze the impact of withdrawing goods costing ₹ 10,000 for personal use on the Inventory Turnover Ratio (ITR). Here’s the breakdown:
Step 1: Recall the formula
Inventory Turnover Ratio = Cost of Revenue from Operations / Average Inventory
Step 2: Initial values
Cost of Revenue from Operations (original): ₹ 2,40,000
Average Inventory (original): ₹ 80,000
Initial Inventory Turnover Ratio:
ITR = 2,40,000/80,000} = 3 Times
Step 3: Adjust values for personal withdrawal
When goods are withdrawn for personal use:
- Cost of Revenue from Operations remains unaffected, as the withdrawal does not represent a sale.
- Average Inventory decreases by the cost of the withdrawn goods.
Adjusted Average Inventory = ₹ 80,000 – ₹ 10,000 = ₹ 70,000
Step 4: Recalculate the ITR
Adjusted ITR:
ITR = 2,40,000/70,000 = 3.43 Times
Conclusion:
The withdrawal of goods costing ₹ 10,000 for personal use increases the Inventory Turnover Ratio from 3 times to approximately 3.43 times, indicating a slightly faster inventory turnover due to reduced average inventory levels.
(f) Goods costing ₹ 20,000 distributed as free samples
Let’s analyze the impact of distributing goods as free samples on the Inventory Turnover Ratio (ITR). Here’s the detailed breakdown:
Step 1: Recall the formula
Inventory Turnover Ratio = Cost of Revenue from Operations / Average Inventory
Step 2: Initial values
Cost of Revenue from Operations (original): ₹ 2,40,000
Average Inventory (original): ₹ 80,000
Initial Inventory Turnover Ratio:
ITR = 2,40,00080,000 = 3 Times
Step 3: Adjust values for free samples
Distributing goods as free samples impacts both inventory and potentially the Cost of Revenue from Operations:
- Cost of Revenue from Operations: It increases because free samples are considered part of the cost of operations.
Adjusted Cost of Revenue from Operations = ₹ 2,40,000 + ₹ 20,000 = ₹ 2,60,000 - Average Inventory: It decreases since the goods are removed from inventory.
Adjusted Average Inventory = ₹ 80,000 – ₹ 20,000 = ₹ 60,000
Step 4: Recalculate the ITR
Adjusted ITR:
ITR = 2,60,000/60,000 = 4.33 Times
Conclusion:
Distributing goods costing ₹ 20,000 as free samples increases the Inventory Turnover Ratio from 3 times to approximately 4.33 times, reflecting a faster turnover rate due to both reduced average inventory and increased cost of operations.
Here is the list of all Solutions.
| S.N | Questions |
| 1 | Question – 1 |
| 2 | Question – 2 |
| 3 | Question – 3 |
| 4 | Question – 4 |
| 5 | Question – 5 |
| 6 | Question – 6 |
| 7 | Question – 7 |
| 8 | Question – 8 |
| 9 | Question – 9 |
| 10 | Question – 10 |
| S.N | Questions |
| 11 | Question – 11 |
| 12 | Question – 12 |
| 13 | Question – 13 |
| 14 | Question – 14 |
| 15 | Question – 15 |
| 16 | Question – 16 |
| 17 | Question – 17 |
| 18 | Question – 18 |
| 19 | Question – 19 |
| 20 | Question – 20 |
| S.N | Questions |
| 21 | Question – 21 |
| 22 | Question – 22 |
| 23 | Question – 23 |
| 24 | Question – 24 |
| 25 | Question – 25 |
| 26 | Question – 26 |
| 27 | Question – 27 |
| 28 | Question – 28 |
| 29 | Question – 29 |
| 30 | Question – 30 |
| S.N | Questions |
| 31 | Question – 31 |
| 32 | Question – 32 |
| 33 | Question – 33 |
| 34 | Question – 34 |
| 35 | Question – 35 |
| 36 | Question – 36 |
| 37 | Question – 37 |
| 38 | Question – 38 |
| 39 | Question – 39 |
| 40 | Question – 40 |
| S.N | Questions |
| 41 | Question – 41 |
| 42 | Question – 42 |
| 43 | Question – 43 |
| 44 | Question – 44 |
| 45 | Question – 45 |
| 46 | Question – 46 |
| 47 | Question – 47 |
| 48 | Question – 48 |
| 49 | Question – 49 |
| 50 | Question – 50 |
| S.N | Questions |
| 51 | Question – 51 |
| 52 | Question – 52 |
| 53 | Question – 53 |
| 54 | Question – 54 |
| 55 | Question – 55 |
| 56 | Question – 56 |
| 57 | Question – 57 |
| 58 | Question – 58 |
| 59 | Question – 59 |
| 60 | Question – 60 |
| S.N | Questions |
| 61 | Question – 61 |
| 62 | Question – 62 |
| 63 | Question – 63 |
| 64 | Question – 64 |
| 65 | Question – 65 |
| 66 | Question – 66 |
| 67 | Question – 67 |
| 68 | Question – 68 |
| 69 | Question – 69 |
| 70 | Question – 70 |
| S.N | Questions |
| 71 | Question – 71 |
| 72 | Question – 72 |
| 73 | Question – 73 |
| 74 | Question – 74 |
| 75 | Question – 75 |
| 76 | Question – 76 |
| 77 | Question – 77 |
| 78 | Question – 78 |
| 79 | Question – 79 |
| 80 | Question – 80 |
| S.N | Questions |
| 81 | Question – 81 |
| 82 | Question – 82 |
| 83 | Question – 83 |
| 84 | Question – 84 |
| 85 | Question – 85 |
| 86 | Question – 86 |
| 87 | Question – 87 |
| 88 | Question – 88 |
| 89 | Question – 89 |
| 90 | Question – 90 |
| S.N | Questions |
| 91 | Question – 91 |
| 92 | Question – 92 |
| 93 | Question – 93 |
| 94 | Question – 94 |
| 95 | Question – 95 |
| 96 | Question – 96 |
| 97 | Question – 97 |
| 98 | Question – 98 |
| 99 | Question – 99 |
| 100 | Question – 100 |
| S.N | Questions |
| 101 | Question – 101 |
| 102 | Question – 102 |
| 103 | Question – 103 |
| 104 | Question – 104 |
| 105 | Question – 105 |
| 106 | Question – 106 |
| 107 | Question – 107 |
| 108 | Question – 108 |
| 109 | Question – 109 |
| 110 | Question – 110 |
| S.N | Questions |
| 111 | Question – 111 |
| 112 | Question – 112 |
| 113 | Question – 113 |
| 114 | Question – 114 |
| 115 | Question – 115 |
| 116 | Question – 116 |
| 117 | Question – 117 |
| 118 | Question – 118 |
| 119 | Question – 119 |
| 120 | Question – 120 |
| S.N | Questions |
| 121 | Question – 121 |
| 122 | Question – 122 |
| 123 | Question – 123 |
| 124 | Question – 124 |
| 125 | Question – 125 |
| 126 | Question – 126 |
| 127 | Question – 127 |
| 128 | Question – 128 |
| 129 | Question – 129 |
| 130 | Question – 130 |
| S.N | Questions |
| 131 | Question – 131 |
| 132 | Question – 132 |
| 133 | Question – 133 |
| 134 | Question – 134 |
| 135 | Question – 135 |
| 136 | Question – 136 |
| 137 | Question – 137 |
| 138 | Question – 138 |
| 139 | Question – 139 |
| 140 | Question – 140 |
| S.N | Questions |
| 141 | Question – 141 |
| 142 | Question – 142 |
| 143 | Question – 143 |
| 144 | Question – 144 |
| 145 | Question – 145 |
| 146 | Question – 146 |
| 147 | Question – 147 |
| 148 | Question – 148 |
| 149 | Question – 149 |
| 150 | Question – 150 |
| S.N | Questions |
| 151 | Question – 151 |
| 152 | Question – 152 |
| 153 | Question – 153 |
| 154 | Question – 154 |
| 155 | Question – 155 |
| 156 | Question – 156 |
| 157 | Question – 157 |
| 158 | Question – 158 |
| 159 | Question – 159 |
| 160 | Question – 160 |
| S.N | Questions |
| 161 | Question – 161 |
| 162 | Question – 162 |
| 163 | Question – 163 |
| 164 | Question – 164 |
| 165 | Question – 165 |
| 166 | Question – 166 |
| 167 | Question – 167 |
| 168 | Question – 168 |
| 169 | Question – 169 |
| 170 | Question – 170 |
| S.N | Questions |
| 171 | Question – 171 |
| 172 | Question – 172 |
| 173 | Question – 173 |
| 174 | Question – 174 |
| 175 | Question – 175 |
| 176 | Question – 176 |
| 177 | Question – 177 |
| 178 | Question – 178 |
| 179 | Question – 179 |
| 180 | Question – 180 |
| 181 | Question – 181 |
| 182 | Question – 182 |
| 183 | Question – 183 |
| 184 | Question – 184 |
